Data Wrangling
Colab Link
Key Concepts
- Identify and Handle Missing Values
- Data Formatting
- Data Normalization
- Binning
- Indicator variables
Dealing with Missing Values
Missing values can be representes as ?, N/A, 0 or a blank cell
We can deal with them via:
- Check with the data colletion source
- Drop the missing value (either variable or the whole column/row
- Replace the missing values with:
- Average
- Frequency
- other functions
- Leave it as missing data
Drop Missing Data
df.dropna() # axis = 0 drops the entire row. axis = 1 drops the entire column
df.dropna(subset = ["col_name"], axis = 0, inplace = True)
# Inplace writes the alteration to the same dataframe and is equivalent to:
df = df.dropna(subset = ["col_name"], axis = 0)
Replace Missing Data
# df.replace(missing_value, new_value)
mean = df["col_name"].mean()
df["col_name"].replace(np.nan, mean, inplace = True)
# If the dataset has missing data like ?, use:
df.replace("?", np.nan, inplace = True)
Data Formatting
In Pandas, we use : .dtype() to check the data type .astype() to change the data type
To change columns name and alter the data with operations
df["city-mpg"] = 235/df["city-mpg"]
df.rename(columns = {"city-mpg":"city-L/100Km"}, inplace = True)

# To identify data type:
df.dtypes()
# To convert data type:
df.astype() # int, float, etc..

df["col_name"] = df["col_name"].astype("int")
Data Normalization
This process makes statistical analysis easier by fixing the different ranges of data in the dataset
# SFS
df["col_name"] = df["col_name"]/df["col_name"].max()

# MMS
df["col_name"] = (df["col_name"] - df["col_name"].min())/(df["col_name"].max() - df["col_name"].min())

# ZSS
df["col_name"] = (df["col_name"] - df["col_name"].mean())/df["col_name"].std()
Binning
- Grouping values into "bins"
- Converts numeric into categorical variables
- Group a set of numerical values into a set of "bins"
For example, binning ages [0 - 5], [5 - 18], [18 - 30] and so on. In addition, sometimes we use data binning to group a set of numerical values into a smaller number of bins to have a better understanding of the data distribution. Using binning, we categorize, for example, the price into three bins: low price, medium price, and high prices.
# Returns an array of four number equally spaced over the specified interval
bins = np.linspace[min(df["col"]), max(df["col"]),4)
group_names = ["Low","Medium","High"]

# Use pandas cut function to segment and sort data values into bins
df["binned_col"] = pd.cut(df["col"],bins,labels=group_names,include_lowest=True)
df["binned_col"].value_counts()
The binned data can be then visualized for example, with an histogram.
Turning Categorical Variables into Quantitative Variables
Most statistical models cannot take in objects or strings as input and for model training only take the numbers as inputs.
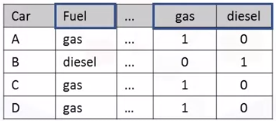
One-hot Encoding
Adds dummy variables (features) for each unique category and assign 0 or 1 in each category.
pd.get_dummies(df["col"])
Code Snipplets
Counting Missing Data
After replacing missing data to numpy NaN, create a new dataframe with fields according to which features and rows are indeed missing data:
missing_data = df.isnull()
missing_data.head(5)

# Count missing values in each column
for column in missing_data.columns.values.tolist():
    print(column)
    print (missing_data[column].value_counts())
    print("")
Whole columns should be dropped only if most entries in the column are empty. Whole row should be deleted in target if the data missing since we don't outliers.
Replacing Data
Average
avg = df["col"].astype("float").mean(axis=0)
df["col"].replace(np.nan, avg, inplace = True)
Frequency or Most Common Value
To see which values are present in a particular column:
df["col"].value_counts()

# To calculate the most common value
most_common = df["col"].value_counts().idxmax()

# To replace
df["col"].replace(np.nan, most_common, inplace = True)
Rows with No Data
df.dropna(subset = ["col"], axis = 0, inplace = True)

# Reset index because rows were dropped
df.reset_index(drop = True, inplace = True)
Binning
%matplotlib inline
import matplotlib as plt
from matplotlib import pyplot
plt.pyplot.hist(df["binned_col"], bins = 3)
pyplot.bar(group_names, df["binned_col"].value_counts()

# set x/y labels and plot title
plt.pyplot.xlabel("xlabel")
plt.pyplot.ylabel("ylabel")
plt.pyplot.title("title")
One-hot Encoding
dummy_variable_1 = pd.get_dummies(df["col"])
dummy_variable_1.head()

# Rename columns if needed
dummy_variable_1.rename(columns={'fuel-type-diesel':'gas', 'fuel-type-diesel':'diesel'}, inplace=True)
dummy_variable_1.head()

# merge data frame "df" and "dummy_variable_1"
df = pd.concat([df, dummy_variable_1], axis=1)

# drop original column "fuel-type" from "df"
df.drop("col", axis = 1, inplace=True)
Remove Outliers
An outlier of a dataset is defined as a value that is more than 3 standard deviations from the mean.
z_scores = scipy.stats.zscore(df)
abs_z_scores = np.abs(z_scores)
filtered_entries = (abs_z_scores < 3).all(axis=1)
new_df = df[filtered_entries]
new_df.describe()
Export
df.to_csv('clean_df.csv')